
Washington State Report Reflects Positive Trends In Hunting, Angling
By Jillian Garrett
Times are changing in the world of outdoor recreation, and nowhere more so than when it comes to wildlife. In the most recent edition of Fishing, Hunting, and Wildlife-Associated Recreation in Washington, a sweeping analysis of hunters, anglers and wildlife viewers put out by the Washington Department of Fish & Wildlife, current trends are pointing to some interesting conclusions.
Clearly, no matter what side of the aisle you come from, wildlife-related recreation is deeply important to Washington residents, with a whopping 72 percent of the population participating in at least some form. These activities are hugely valuable to both the state and its wild creatures, by providing vital dollars that get funneled into conservation as well as local economies.
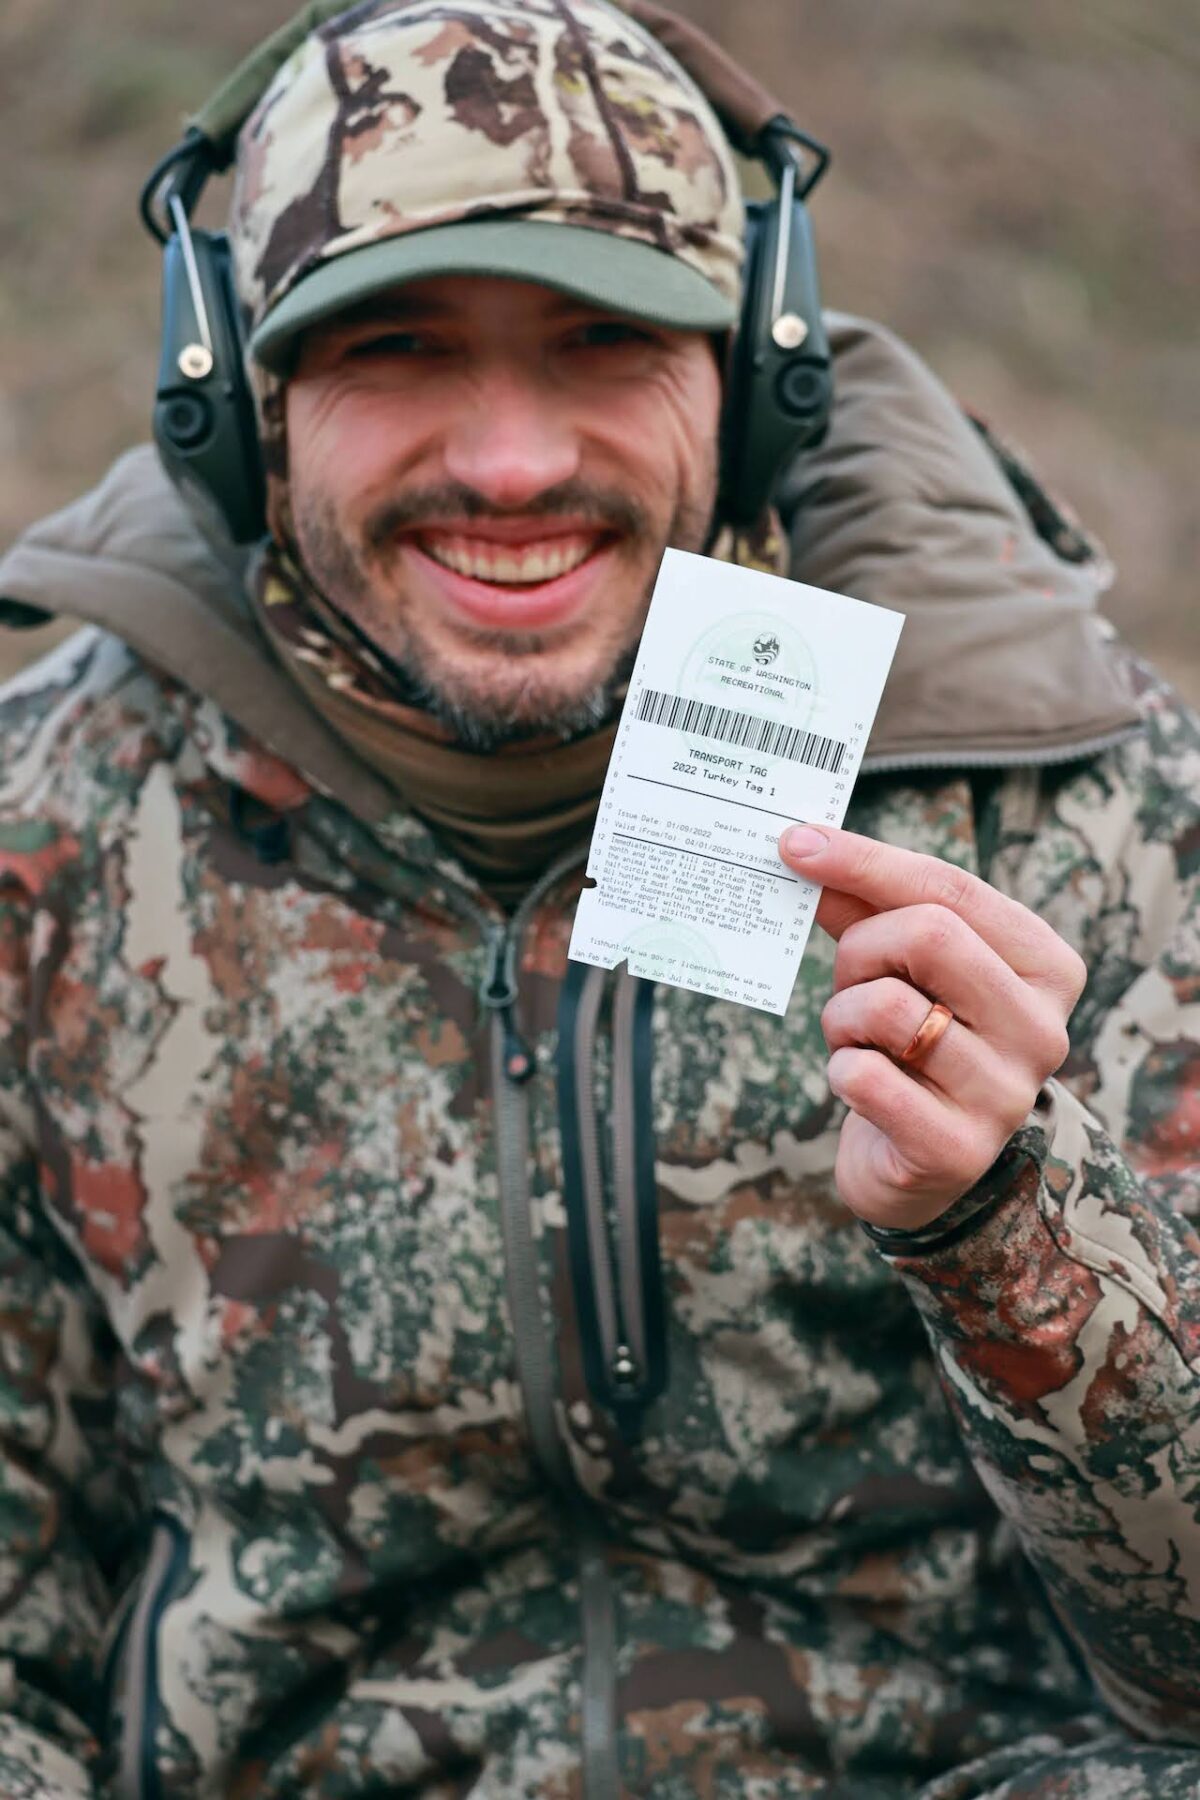
Certain special interest groups, citing this recent report, have made the criticism that hunters comprise a much lower portion of the population compared to wildlife viewers, with the implication being that hunters should not have as large of a say in decisions made involving wildlife management. However, what this report shows is that while hunters may account for a small portion of the populace, in terms of dollars spent, they (along with anglers) are the biggest funders of wildlife conservation.
AT FACE VALUE, Recreation in Washington seemed to convey that wildlife watchers made up the biggest group of wildlife-related recreation, followed by anglers, and finally by hunters. With that statement, what is important to keep in mind is that the report’s definition for wildlife viewing was extremely broad, especially when compared to hunting and angling.
Wildlife watching, both at home and away on trips, was broken down into the following six general categories: closely observing wildlife, photographing wildlife, feeding wildlife (this could include things such as using birdfeeders), visiting public parks or areas, maintaining plantings, and maintaining natural areas (these last two categories could conceivably be anything from planting a pollinator flower garden to growing a deer food plot). The average annual participation for these nonconsumptive users was around 70 days.
Ironically, according to the report, “scouting for the purposes of hunting or fishing is not included in this definition of wildlife watching,” nor was it included in the number of days spent hunting and fishing (which also begs the question, were scouting-related trip expenditures even counted as part of the annual funding contributions?). This had the effect of limiting the ability of hunters and anglers to count themselves amongst wildlife watchers, and drastically misrepresented the amount of time that they spent outdoors enjoying nature.
This omission seems rather odd, as many wildlife encounters often happen during hunting and angling trips, especially scouting ones. How many hunters have enjoyed the manic activities of squirrels when out in the woods, or how many anglers have reveled in a glimpse of bighorn sheep on the cliffs above the river?
As a result, consumptive groups such as big game hunters were only clocked at an average of seven days per year in the field, which seems a bit short of reality, and perhaps also feeds into the unintentional bias that hunters and anglers cannot also be wildlife lovers.
THE REPORT CONTAINED a summary of the annual expenses associated with the participation of the three user groups. These expenditures, when broken down, showed that the consumptive use groups (i.e. hunters and anglers) outspent nonconsumptive users by an incredibly wide margin. An important point to keep in mind here is that wildlife watching only contributed to the local economy, whereas hunting and angling contributed to the economy and conservation via Pittman-Robertson and Dingell-Johnson Act excise taxes on gear.
Another interesting aspect to all of this is that hunters in Washington spent approximately twice as much on equipment than hunters in other states, while their trip expenses were about the same as the national average. This is worth noting because it means that Washington hunters contributed more money towards Pittman-Robertson (and therefore conservation) than the national average.
Meanwhile, Washington wildlife watchers had average annual trip expenditures that were about half the national average, meaning that they funneled less money into the economy compared to their counterparts in other states. The report interpreted this as possibly being due to the abundant wildlife viewing opportunities that Washington residents have available close to home.
According to the report:
Wildlife watchers spent $937 per year;
Anglers spent $1,781 per year;
Hunters spent $3,688 per year.
From this, it’s easy to see that consumptive users are important funding contributors.
A major criticism leveled at WDFW in recent years is that the money it spends on so-called “R3” efforts – recruiting, retaining and reactivating hunters and anglers, part of a national movement strategically focused on increasing participation – is wasted. However, as the report proves, hunters and anglers spend significantly more money (and therefore contribute more funding) than wildlife watchers, meaning that every person who can be converted from a wildlife watcher into a hunter or angler will therefore provide two to four times more funding power to both the state economy and wildlife conservation.
In short, R3 funding is deeply important because it translates into an excellent return on investment for both the state and its wildlife.
SPECIAL INTEREST GROUPS try to downplay the importance of funding contributions made by the hunting and angling communities, claiming that the general public pays far more money for conservation in the form of the state’s General Fund. This fund is composed of a wide range of state-tax-generated revenues that can be earmarked for numerous different outlets, not necessarily specifically for wildlife conservation.
The General Fund provides about 50 percent of WDFW’s overall annual operating budget. It is worth noting that hunters and anglers also pay into the General Fund alongside the rest of the population, while also contributing to wildlife-conservation-specific funding through tax revenues generated by the Pittman-Robertson and Dingell-Johnson Acts. This additional conservation-specific funding makes up 4 percent of WDFW’s operating budget.
Hunters and anglers contributed a further 19 percent to WDFW’s budget through the purchases of licenses and tags, as well as special wildlife-themed license plates, Discover Passes and similar items.
Through these two contribution categories alone, hunters and anglers funded a whopping 23 percent of WDFW’s annual budget.
The overall financial contributions of the hunting and angling communities aren’t finished: According to the report, these two groups make up only 18 percent1 of the state population, paying into the state’s General Fund along with the rest of the populace. While the exact structure of the General Fund is a bit too complex for the focus of this article, it is reasonable to assume that the average state resident contributes the same average dollar amount to the General Fund. Extrapolating from that, if hunters and anglers make up 18 percent of the state population, it is probably safe to suppose that they also contribute 18 percent of the General Fund.
With the General Fund supplying 50 percent of WDFW’s annual operating budget, that would mean that consumptive users are providing 9 percent of that figure. Meaning that hunters and anglers, while only comprising 18 percent of the total state population, may conceivably contribute 32 percent of WDFW’s annual budget. That is an enormous chunk of the operating budget, making hunters and anglers significant contributors to wildlife management, and cementing the conclusion that they absolutely deserve their seat at the negotiation table when it comes to policy decisions.
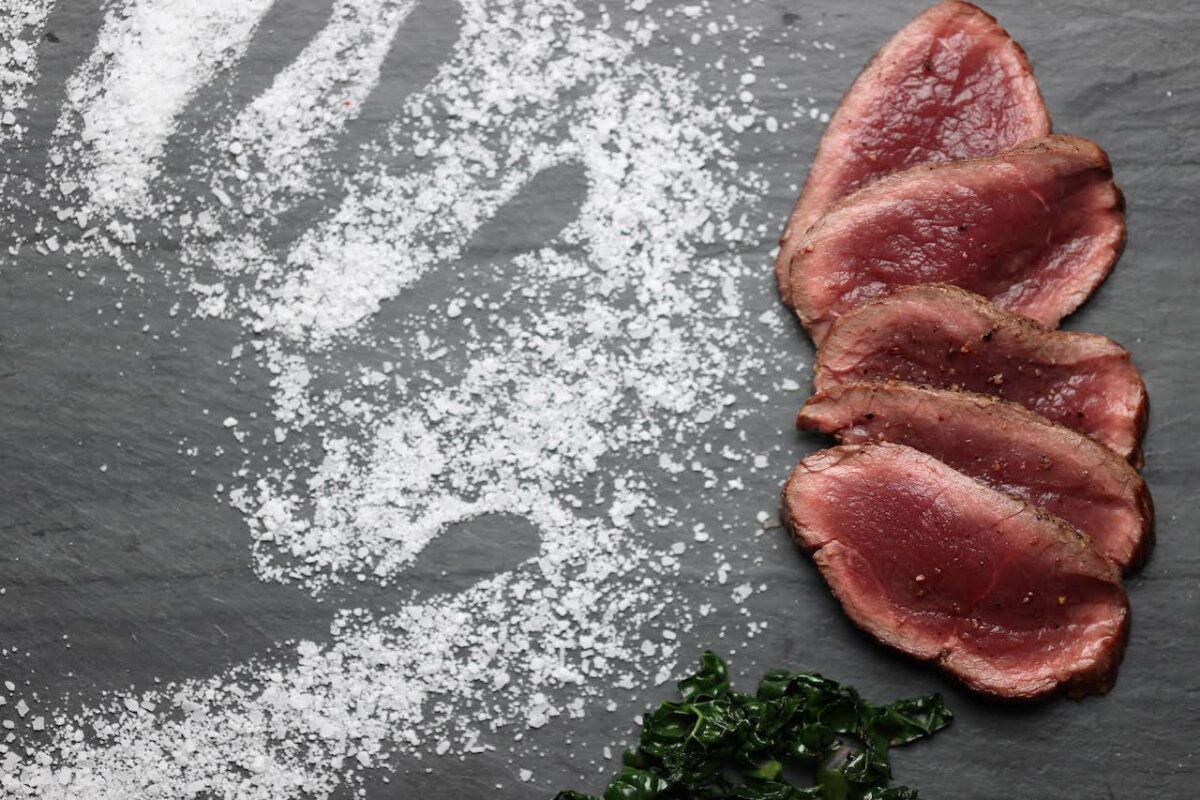
IT’S WORTH TAKING a moment to note one other significant aspect gleaned from this report, especially in light of recently proposed legislation to amend the state constitution to protect the right to hunt, fish and forage: the importance of hunting and angling as a method of procuring food.
While most hunters, anglers and wildlife watchers enjoyed a comfortable annual income of around $50,000 to $75,000, participation in the hunting and angling communities showed a sharp increase for those with an income level of less than $10,000 per year. The assumption is that for lower income residents, hunting and fishing provides an important way of obtaining food, adding value to the argument that denying hunting and fishing opportunities endangers the ability of people to feed themselves.
Another interesting takeaway for the hunting community from this report may be recognizing the persuasive power of the angling community when it comes to consumptive use issues, as fishermen represent the second largest participation group in wildlife-related recreation. The recent state Senate Bill 6294, prohibiting the unlawful trade of fur products, was roundly defeated in large part due to the uproar it caused in the angling community, as the bill’s language would have hindered the ability to create fly fishing lures with animal fur.
This example goes to show that the hunting community could deeply benefit by reaching across the aisle and teaming up with anglers on consumptive use policy issues.
EXAMINING THE COMPOSITION of the two consumptive user groups is also deeply interesting. Surprisingly, the gender gap is far narrower in the Washington hunting community than elsewhere in America, with 41 percent of hunters identifying as women. This is something to be celebrated, as it is a much higher percentage than the national average of 22 percent, helping to break the stereotype that hunting is a boys-only club.
In the angling community, the gender gap continued to mirror national averages, with only 26 percent of anglers identifying as women. While the hunting community may have a narrower gender gap, both user groups could still benefit from greater recruitment and inclusion of women participants – something to perhaps keep in mind for R3.
When it comes to diversity, trends within the hunting community mirrored national averages, with participation rates being highest among residents who identified as Asian, followed by those identifying as Hispanic and as white. The participation rate was lowest for those identifying as Black, non-Hispanic, and all other non-Hispanic residents. While the elevated participation rate among Asian residents and lower rate among Black residents is consistent with national patterns, there is still significant room for improvement.
These trends show a need to work with organizations such as Hunters of Color and First Hunt Foundation’s Forgotten Rites Initiative to help increase diversity and inclusion within the hunting community, as well as help provide access to hunting areas (which can often be a barrier to entry).
Diversity was higher amongst the angling community: While the majority of people who participated in fishing were white, the composition of the angling community proved to be more racially and ethnically diverse than the state population overall. Anglers demonstrated highest participation rates amongst those identifying as Hispanic and as Asian. Meanwhile, participation in anglers identifying as Black was once again among the lowest state participation rates, as well as being lower than the national average. Thus, the argument continues for a need to increase diversity and inclusion within the angling community.
AT THE END of the day, the biggest takeaways from this report are all positive points in favor of Washington’s consumptive user groups: that hunters and anglers fund the lion’s share of WDFW’s annual budget and wildlife conservation; that Washington hunters have a narrower gender gap and Washington anglers have a higher level of ethnic diversity than national averages; and that hunting and angling remain important ways of obtaining food for significant segments of the populace. While there is always room for continued improvement (such as better diversity and inclusion), these are all things to celebrate. They are also important points to utilize as tools in the ongoing debate over consumptive use policy.
While wildlife-related recreation is deeply important to most Washington residents, the funding contributed by the hunting and angling communities towards conservation means that they have every right to have a major say in how state wildlife is managed. Though hunters and anglers may only represent a minority of the state population, funding provided by these two groups contributes nearly a third of WDFW’s annual operating budget, meaning that while most of Washington may cherish its wildlife, hunters and anglers are the ones who provide the actual dollars to ensure that it remains safe for current and future generations.
Editor’s note: Author Jillian Garrett is a hunter, farmer and conservationist living in Northeast Washington. She and her husband operate a regenerative farm with a focus on wildlife conservation through responsible land stewardship.Jillian’s writing and photography have also appeared in Sports Afield, Bear Hunting Magazine and Blue Ridge Farmer Magazine. A member of First Hunt Foundation, she remains passionate about the importance of mentorship within the hunting community.
1According to the report, 17 percent of Washington’s population fishes and 4 percent hunts. However, these numbers cannot be added together to encompass the total number of sportsmen due to a great deal of crossover between the two groups (i.e., many hunters also fish and many anglers hunt). When you account for the people who both hunt and fish, it brings the total number of consumptive users closer to 18 percent of the state population.
